What does geo3D do and why?#
The following section aims to explain what geo3D produces, the creation process, the necessary ingredients and the usefulness of the product.
1. What does geo3D do?#
The primary product is a semantically rich, topologically correct Level of Detail 1 (LoD1) 3D City Model*. Secondary products include an application of spatial data science and an HTML-based visualisation.
* the goal is a Open Geospatial Consortium (OGC) standard model that conforms to the ISO 19107 spatial schema for 3D primitives [connecting and planar surfaces, correct orientation of the surfaces and watertight volumes]. If the result you achieve is not; you are welcome to raise an issue.
2. geo3D products#
LoD1 3D City Models#
How? extrusion!#
An extremely well documented method of producing 3D Models is through extrusion. With extrusion; 2D features are lifted from an existing surface creating a volumetric 3D object. geo3D infers the height with which to lifted 2D features from OSM contributions.
The OSM tag building:level is taken as a proxy for the height of a building. The calculation is simply building:level * 2.8 + 1.3. If a structure does not have a building:level tag no LoD1 model is created.
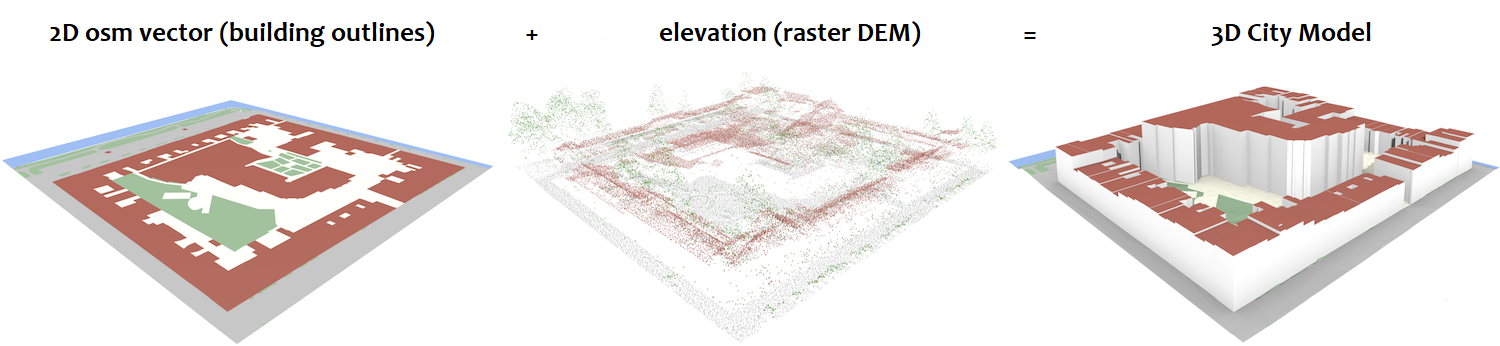
Fig. 2 The osm_LoD1_3DCityModel process. Image adapted from [Ledoux et al., 2021].#
Fig 1 illustrates the process where the OSM proxy building:level height is added to the raster DEM to create a 3D topologically connected surface ~ containing 2D polygons as 3D objects.
CityJSON#
The LoD1 3D City Model (buildings and terrain) is encoded in the light-weight JSON-based CityJSON format. In the CityJSON format these are Building City Objects separate from the TINRelief (ground)
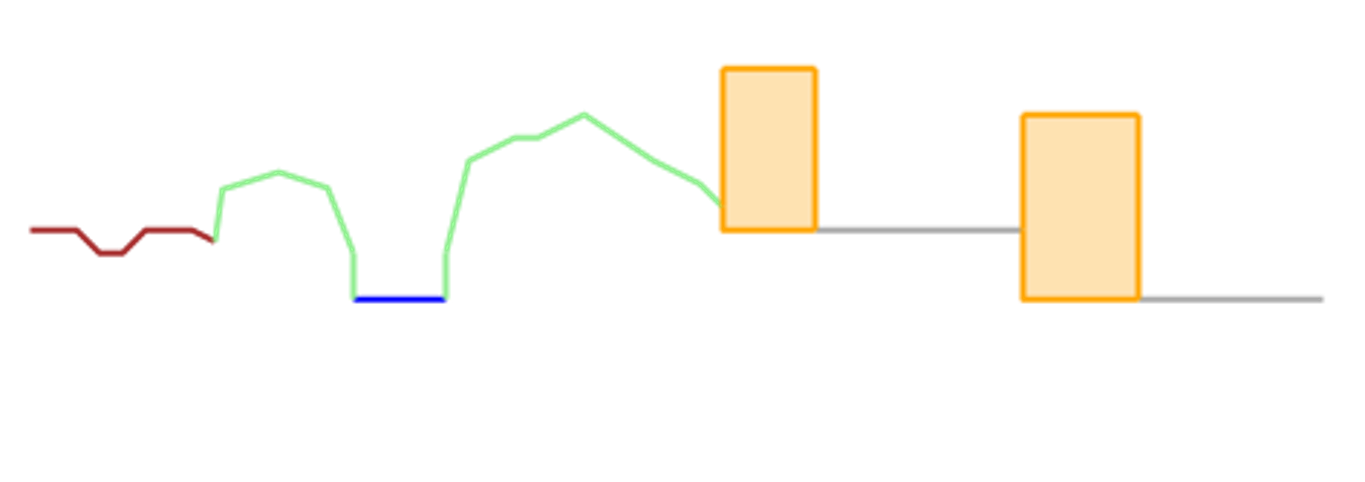
Fig. 3 Solid Building CityObjects connected to the terrain. Image adapted from [Ledoux et al., 2021].#
Spatial Data Science#
The Jupyter environment allows for extensive customisation and deep analysis through spatial data science [Granger and Perez, 2021]. geo3D estimates population and calculates Building Volume Per Capita (BVPC).
While estimating population is well-known; BVPC is a fairly recent evaluation. BVPC builds on the work of and attempts to integrate with several Sustainable Development Goals (most notably: SDG 11: Developing sustainable cities and communities) [Reddy and Leslie, 2015, United Nations. Department of Economic and Social Affairs, 2012]. BVPC represents the cubic meter of building per person. The value quantifies the amount of living space each person has in their home. BVPC can be used to evaluate overcrowding, and as a proxy for economic and housing inequality [Ghosh et al., 2020].
Interactive visualisation#
Further; geo3D can produce a pseudo-3D HTML-based visualisation serves to facilitate engagement and understanding at a neighbourhood level.
To navigate on a laptop without a mouse:
trackpad left-click drag-leftand-right;Ctrl left-click drag-up,-down,-leftand-rightto rotate and so-on and+next to Backspace zoom-in and-next to+zoom-out.
The iframe above illustrates building stock differentiated by colour. A school, housing, retail, healthcare and community focused facilities are easily identified while the tooltips highlight the underlying data. Additional features unique to any area can also be included. Here farmland, streams, recreational spaces and bus rapid transit routes have been added - you are thus limited only through data and your imagination.
3. Is it useful?#
A LoD1 City Model, while basic, offers many advantages over 2D datasets. These may be used for shadow analyses, line of sight predictions, flood simulation, or more advanced quantitative evaluations such as well as simulating noise propagation [Biljecki et al., 2015].
geo3D illustrates both basic and advanced applications. Population estimation and the calculation of BVPC are easily possible with little to no external resources while estimating wind comfort factor, and an Universal Thermal Comfort Indicator (UTCI) require external software.
With the coming revolution in air traffic control, to accommodate newer forms of air services (delivery drones and urban air mobility), an accurate digital representation of the built environment will become crucial. A 3D City Model is one component for the effective air space management of the future**.
Challenges do exist. Of primary concern are errors in the source data that propagate to the generated 3D model. Care must be taken to ensure the quality of both the vector building outlines and raster DEM.
** have a look at RefMap; next generation multi-scale aviation planning where Computational Fluid Dynamic (CFD) simulations –that employ 3D City Models– use environmental data, such as wind and noise, to optimise flight trajectories.